Malware analysis - rig ek 25/06/2019 - Part 1
Intro
I’ve started on malware analysis almost 2 years ago. But I’ve never dig down into reverse the assembly code and learn move techniques to gather IOCs.
I’m writing this post to explain a recent malware (Rig EK sends pitou.b) that appeared in recent campains. You expect to see:
- Reverse engineering binaries
- Debugging binaries
- Patch binaries
- Antiforensics/reverse techniques such as:
- Anti-VM jiu jitsu
- Anti-debugging taikondo
- Unpacking PEs karate
- Shellcode injection
- Remote process injection (Not used in this example but imporant to talk)
- Self injection
- Windows API usage
Environment
The environment to tear down this malware is as follows:
- VMWare (for virtualization ofc)
- Windows 10 (our victim with stable snapshot)
- x32dbg (The binary is 32 bit)
- Fiddler (To monitor our web activity)
- PE Studio (To check PE files and unpacked from memory PEs)
- PE Bear (To change segments on PE from disk to mapped or unmapped)
- Process hacker (To just monitor possible remote process injections)
- HxD (To resize dumped memory allocations to valid PE files)
- Ghidra (Just to take advantage of C-like code from assembly)
The binary
Basic stuff:
- SHA256: 835873504FDAA37C7A6A2DF33828A3DCFC95EF0A2EE7D2A078194FD23D37CF64
- ASLR: No
- Mode: x86 (32bit)
- Entropy: 6.74
- Resources: 15 Icons
- Sections: text (exec), rdata, data (write), rsrc, realoc
- Libraries: kernel32.dll and user32.dll
- kernel32.dll imported 107 functions
- Includes Anti-VM (IsDebuggerPresent) and Anti-Debug (IsProcessorFeaturePresent)
- user32.dll imported 5 functions
- kernel32.dll imported 107 functions
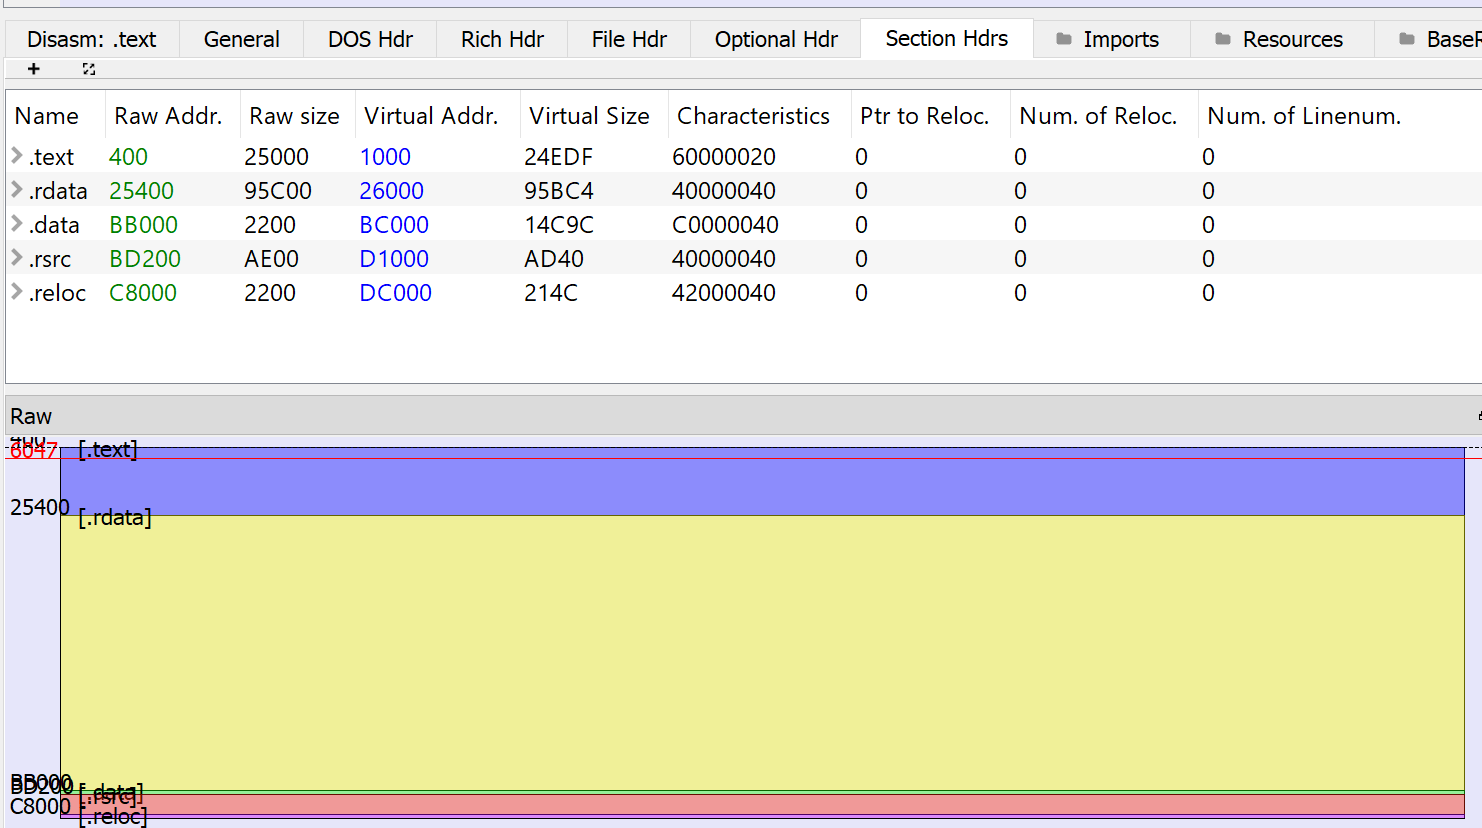
It has a huge rdata segment which it’s a indicator that this software is probably packed.
Strings everywhere
The first anlysis is to see what libraries it will load dynamically so lookup for startings on packed binary:
PDB:
- C:\vezotakolotareni_yudorasosepugu_zuposutosiraromijiro mube.pdb
Status regarding network:
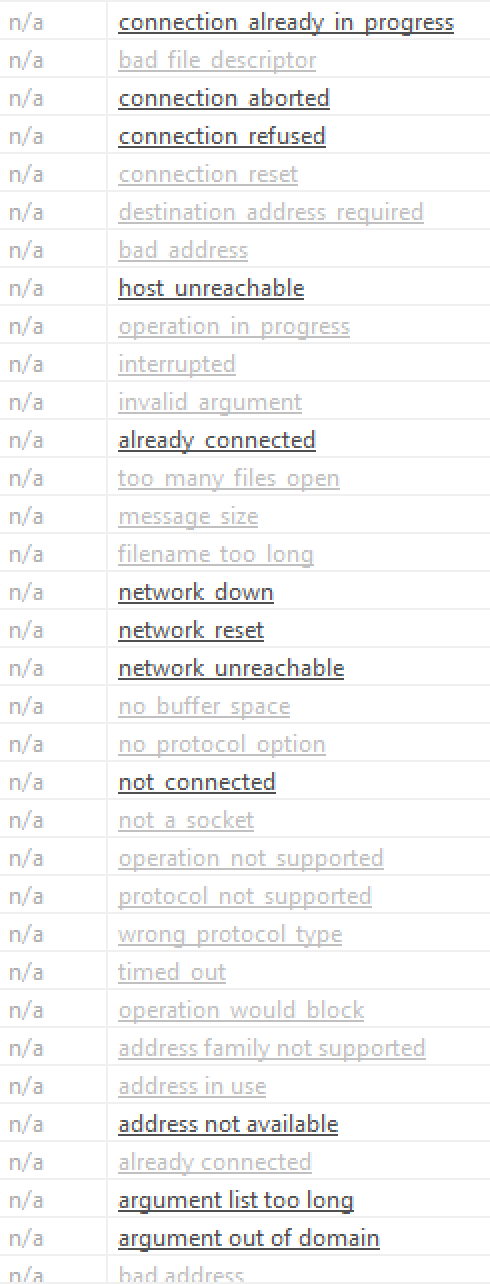
Weird long strings that looks like tor onion-like domains:
- vixuwuxebopugulutegemezivusuxife kab vowosususoyefopozecililuhoceva bezabagivatamigonibeyubagoduni kuzihitebomubugapuyamogodigepudi
- xayohemodozemabohuzi dudasihuwefesi
- gutu maworimokikavipexe fomisiyesilopezoyamuxamuga niwa
- xuwonumuziwutatu si pezawevocametacapudi yokoxacigehudi
- hivurewoguvada xopexivikoyumejokalibulodewodahu yigozedumo solufumakono
- dusacefamohakovifelejopaduwe bexerikono
- retuyibevenivuxuyotonoze xetipozayumuvumipegiso
- yeyebabumazokomimipawi vidoja vojeze tesozefa
- yetorufa licumodunu besupubafabekaxejerixemaki cora jewivecixi
- dofedazayaretaxuguyoxilicu zuhora pihubopuwepipatotoweyi rokupagohedugizowika
- diposidemubicasobewawe tikisu kilenezejijeseparijepena
- hosehobuyube bahefinusexebujeyi dalo topadicanikuvitebavevahubalamu cagakilisa
- nexicomasobacojoga lidi rufakewido romayenugejemubudeda
- xiviyefikexu zobopexahizejinovi ba papomaga
- minewedovode sijokokubatatusefenegemi disovuyo cuyamerupegerasi kayeva
- akocejisifuxe yetovezovozasoge
- winijijuwegezicijuxepoyowure
- yoxakazoxi xevohisotela yotadegavojusasefogo vin
- kuyuke conixesokilazatojovipisaneni jagumexewidobadekanijavu dekuruvasace sowiyoromoxivapokoluvatogusaku
- zuxupekegapoli fefaxagafubolisekolewekoliluke
- gacohisazicojiwi cicalurihuvuwasujetazomopu
- tadobigepubeciwefexohezu dicowubafehalutagaku nusoyufokevoyadoleyepexidi
- tayedexohuwanu zonovomakujo jixadojovetonikutokemo
- xeholelutezo ziseyitimurirehisu fa cujijayaxezisuwanexanakobica josayuhedahepivohakulubibepomi
- pagofakefo
- nupovuda befunubo kadojipazokexoyuximo vucinesu
- wabifekuticugonofo batofopuru yadepaxifuwikuyolimuro
- cuwayopobojojujazuzefivomovo
- tutocalu jikaluzu vutohetidi xavalupeduluvamu
- hejapulozuwegohuwuhi
- muhuvozuxiliwisipe
Black-listed import names:
- OpenDesktopW
- GetVolumePathNamesForVolumeNameW
- FindFirstVolumeMountPointA
- GetModuleHandleExW
- GetModuleFileNameW
- GetModuleFileNameA
- ReadConsoleW
- FillConsoleOutputCharacterW
- WriteConsoleW
- SetConsoleCtrlHandler
- GetFirmwareEnvironmentVariableA
- QueryPerformanceCounter
- RaiseException
- OutputDebugStringW
- GetOverlappedResult
- MoveFileW
- GetCurrentProcess
- TerminateProcess
- GetCurrentThread
- GetCurrentThreadId
- GetCurrentProcessId
- GetEnvironmentStringsW
- FreeEnvironmentStringsW
- GetProfileIntW
- WritePrivateProfileStringA
- WriteProfileStringW
- DefineDosDeviceW
- SetLastError
bp on strategic windows APIs
So I’ve setup break points on the following calls:
- LocalAlloc
- VirtualAlloc
- VirtualProtect
- LoadLibraryA and W and its Ex’s
- GetProcAddress
- IsDebuggerPresent
- IsProcessorFeaturePresent
- WriteFile

Execution
We know it has anti forensics features so we need to be careful on bp and patch in runtime the binary. We hit the start (after it breaks on EntryPoint) and the frist break is on GetProcAddress.
ESI register has GetProcAddress address code (0x74E14EF0) and on stack is pushed “FlsAlloc” which means it is resolving the address of FlsAlloc.


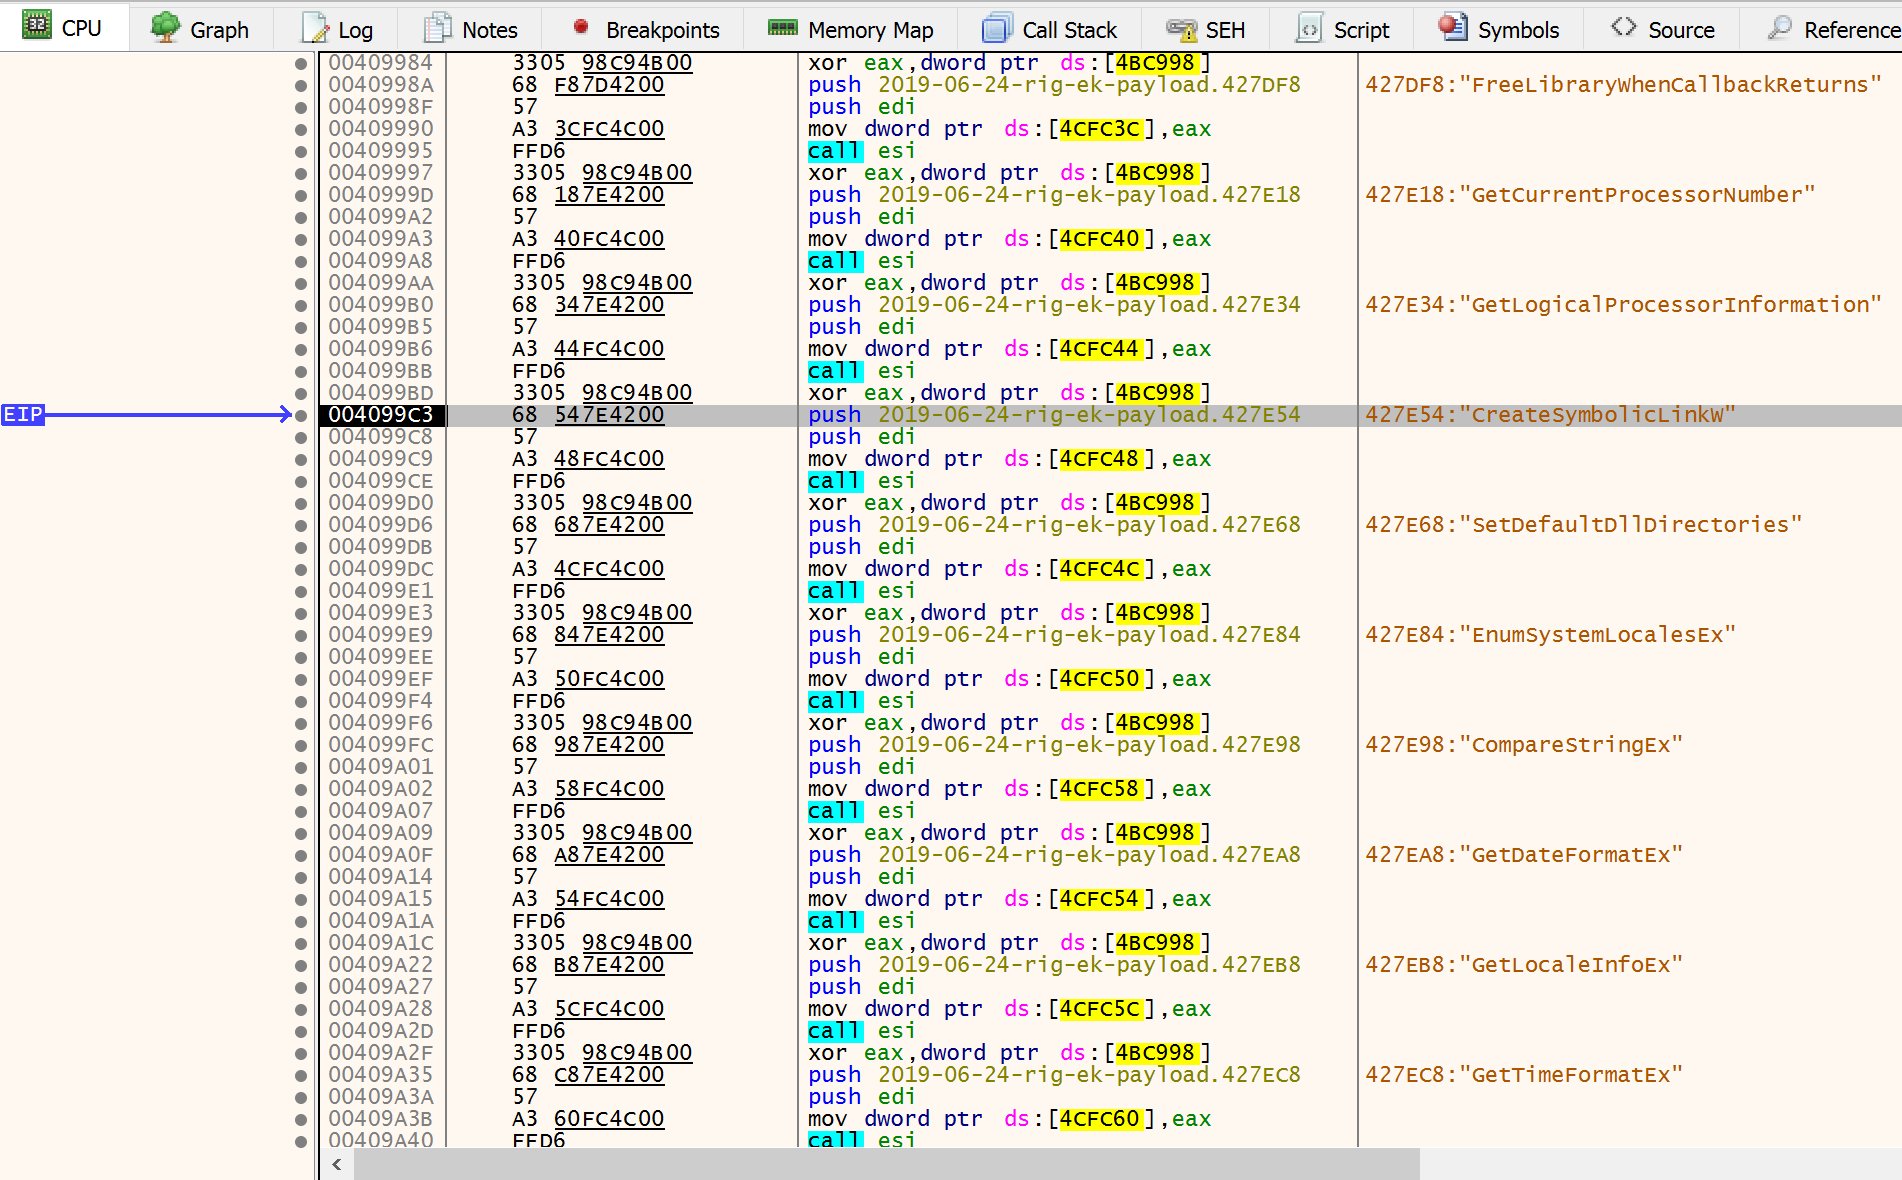
There are a lot of legit software that loads FlsAlloc. But we keep hit run button until we stop on something interesting like GetCurrentProcessorNumber and GetLogicalProcessorInformation .
After that we hit “run until return” and the value on EAX will be the Procedure Address returned by GetProcAddress. We can use this value to follow in dissassembly and add a breakpoint on execution.

We can see also all the procedures on dissasembly window:
So we hit again run some times and bp on CompareStrings (because it’s strange to use kernel compare string) until we reach IsProcessorFeaturePresent.
We can see on stack that 0xA is being pushed into stack. By convention this indicates the first (unique) argument. Follow Microsoft documentation the Processthreadsapi.h
BOOL IsProcessorFeaturePresent(
  DWORD ProcessorFeature
);
It requests if 0xA (ProcessorFeature) is available or not and returns this value on EAX. This parameter, 0xA is 10 in decimal. So checking the website 10 is PF_XMMI64_INSTRUCTIONS_AVAILABLE (SSE2 instruction set)
At this time I have no idea if this is part of malware or just windows stuff.
The return value on my case is 1. So it supports SSE2 instruction set. If we keep running I can notice that is calling a lot of times this with the same value 0xA.
Taking a look on ghidra decompile feature:
  if (uBytes_004caffc == 0x6016e) {
    LocalAlloc(0,0);
    GetPrivateProfileSectionW((LPCWSTR)0x0,local_b2c,0,(LPCWSTR)0x0);
    LoadLibraryA((LPCSTR)0x0);
    OpenDesktopW((LPCWSTR)0x0,0,0,0);
    IsWindowUnicode((HWND)0x0);
    GetClientRect((HWND)0x0,(LPRECT)&local_304);
    SetDlgItemInt((HWND)0x0,0,0,0);
    _exit(0);
    pcVar1 = (code *)swi(3);
    (*pcVar1)();
    return;
  }
  iVar3 = 0;
  do {
    GetTickCount();
    GetMenuBarInfo((HWND)0x0,0,0,(PMENUBARINFO)0x0);
    IsProcessorFeaturePresent(0);
    if ((0x1b9ab1 < iVar3) &&
       (((local_148 != 0x60051d89 || (local_148 >> 0x1f != 2)) && (local_310 != 0x66729f13))))
    break;
    iVar3 = iVar3 + 1;
  } while (iVar3 < 0x301c8ffd);
  FUN_00401a48();
  local_84 = LocalAlloc(0,uBytes_004caffc);
  iVar3 = 0;
  do {
    if (iVar3 == 0x3f80ed) {
      DAT_004cbbbc = DAT_004bdc7c;
      DAT_004c6c74 = (code *)local_84;
    }
    iVar3 = iVar3 + 1;
  } while (iVar3 < 0x7aa767);
  uVar2 = 0;
  if (uBytes_004caffc != 0) {
    do {
      local_84 = (HLOCAL)(DAT_004cbbbc + 0x8f176);
      *(undefined *)((int)DAT_004c6c74 + uVar2) = *(undefined *)((int)local_84 + uVar2);
      uVar2 = uVar2 + 1;
    } while (uVar2 < uBytes_004caffc);
  }
  FUN_004012cf();
I think this could be GUI setup. To avoid wasting time let’s bp out of the loop (until iVar3, this case ESI register) is 0x301c8ffd and disable, for now, the bp at IsProcessorFeaturePresent.

We hit run and we bp at LocalAlloc. This can be an indicator of feature unpack. Can be remote or self. Run until return to get the address of a new allocated memory space with the size of 0x8AA78 (on stack) (arround 567928 bytes).
During my analysis the return value of a new allocated space is 0x020D1020. We follow that into memory map and create an bp on execute.
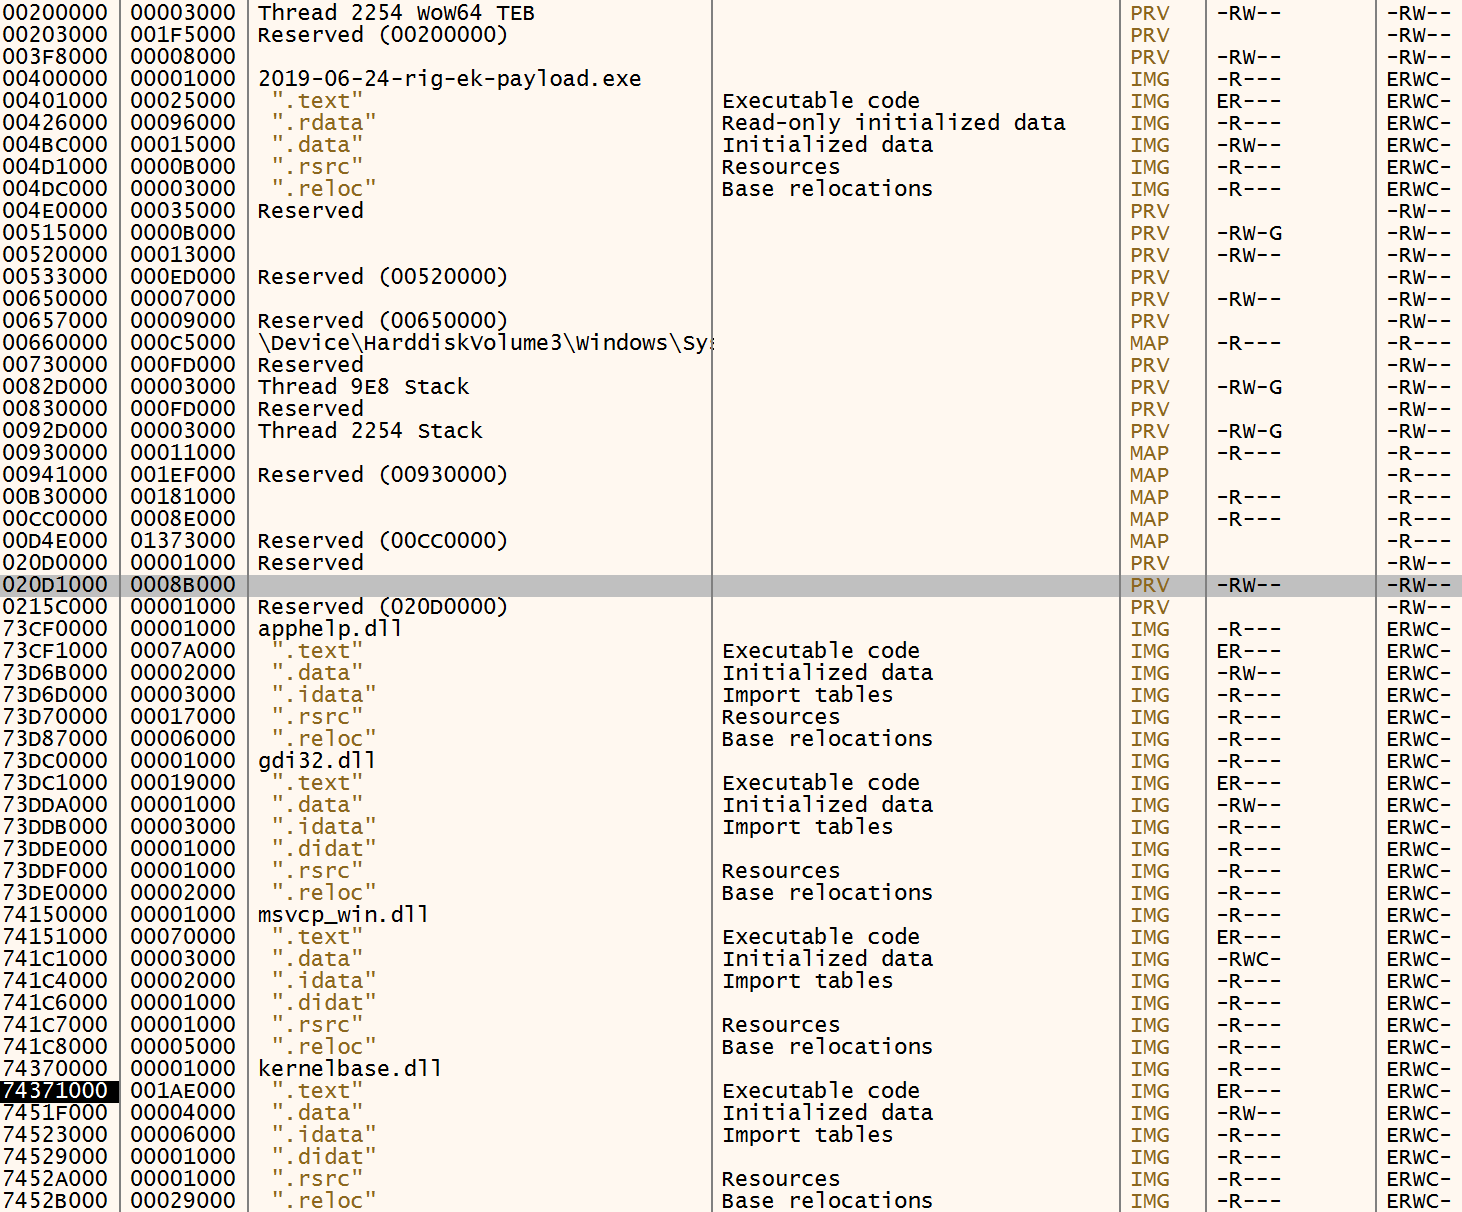
Then we hit run and now it’s running with hitting a brakepoint for a while. If we hit “Pause” we can see we are now pause on this loop:

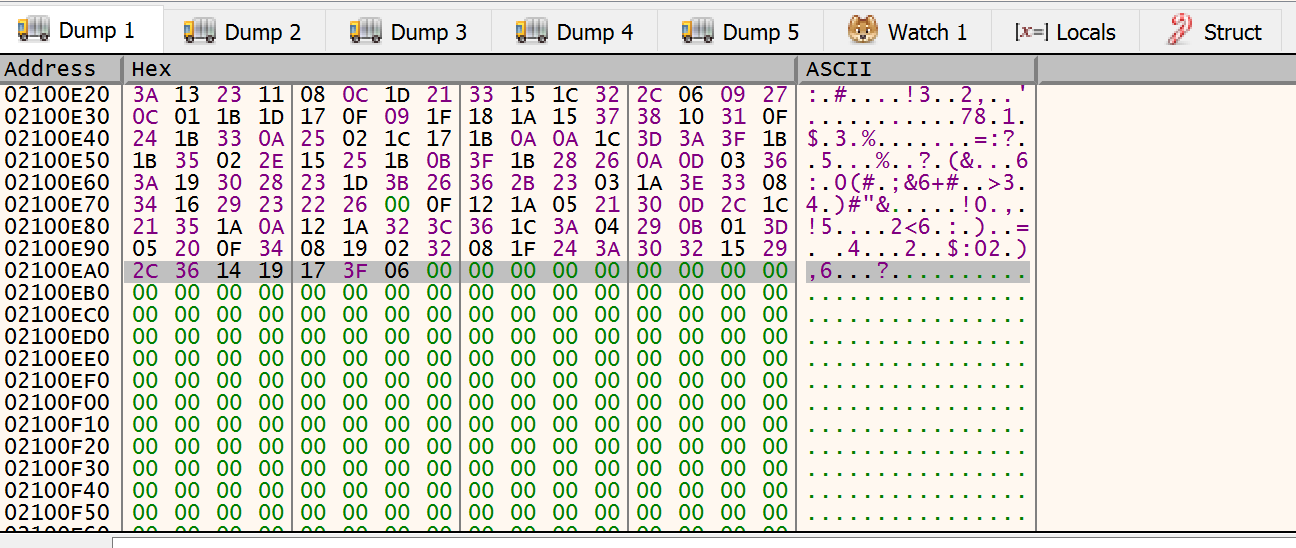
and then BOOM!!. ACCESS_VIOLATION. Somehow it crashed accessing [eax+edx] memory 0x020D1020+0002FE87=0x2100EA7.
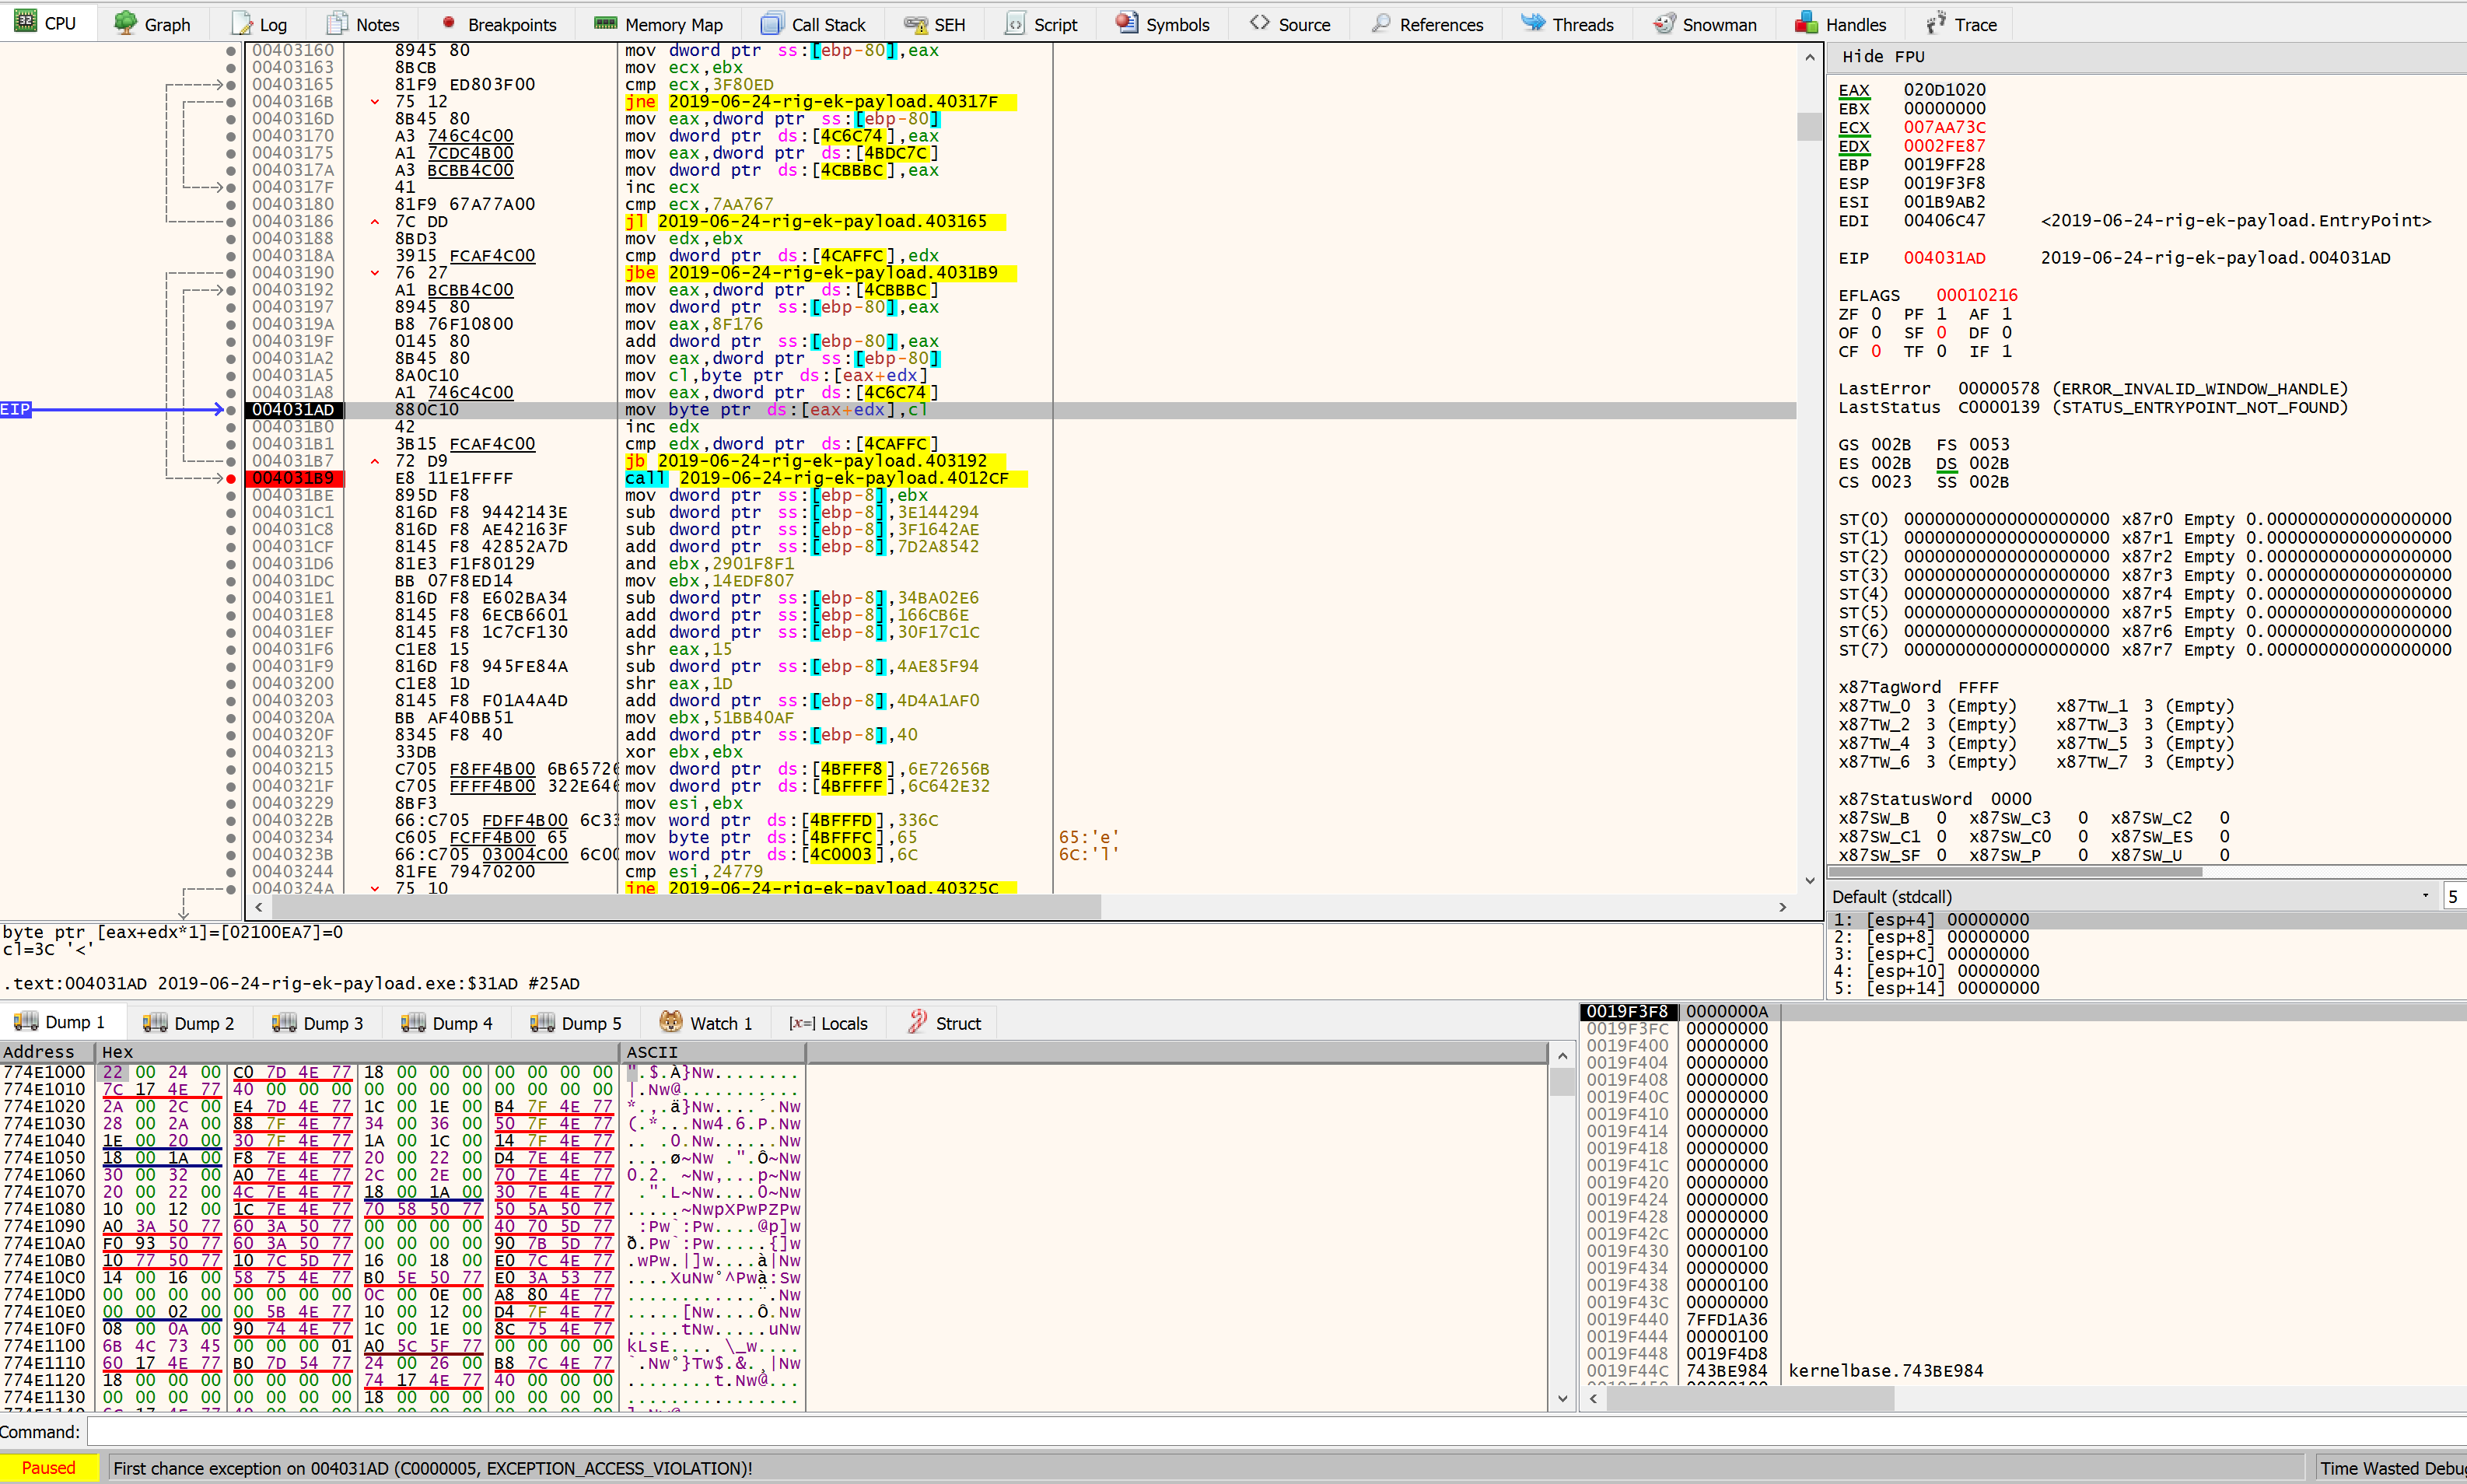
As we can see by the print screen, the EAX was loaded with the base address of recent allocated memory by LocalAlloc and EDX (destination) was acting like an i in for loop.
The assembly code is coded to move a byte only in cl register.
mov byte ptr ds:[eax+edx],cl
Following the memory we can see that a huge nonsense has been moved to this memory section:
