Malware analysis - rig ek 25/06/2019 - Part 2
Part 2
To check the first part please go to https://ret.re/malware/reverse/engineering/2019/07/02/malware-analysis-rig-ek.html .
Progress
I though that the crash could be some problem on debugger. So I cleared the breakpoints and just added after the mov’s into the allocated space and let it run. It’s a slow process because of our execute break point on ALL memory segment.
After a while BAM! breakpoint hit:
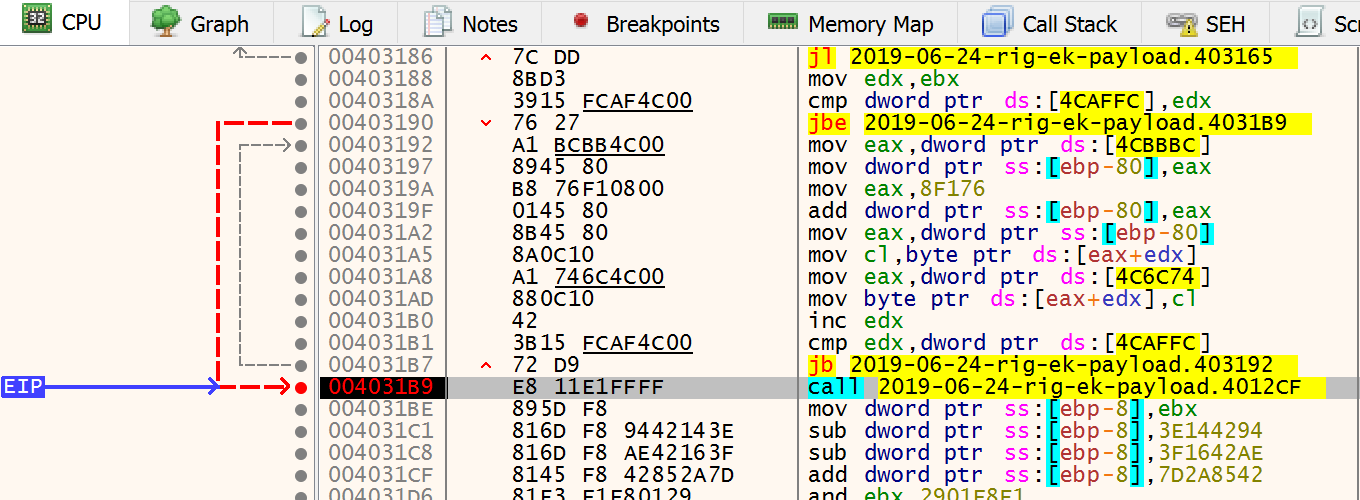
So, it’s time to renable all breakpoints and continue to run!
We are now in an interesting function. It’s a function that uses a suspect calls and seems to decode the previous tor onion domains.
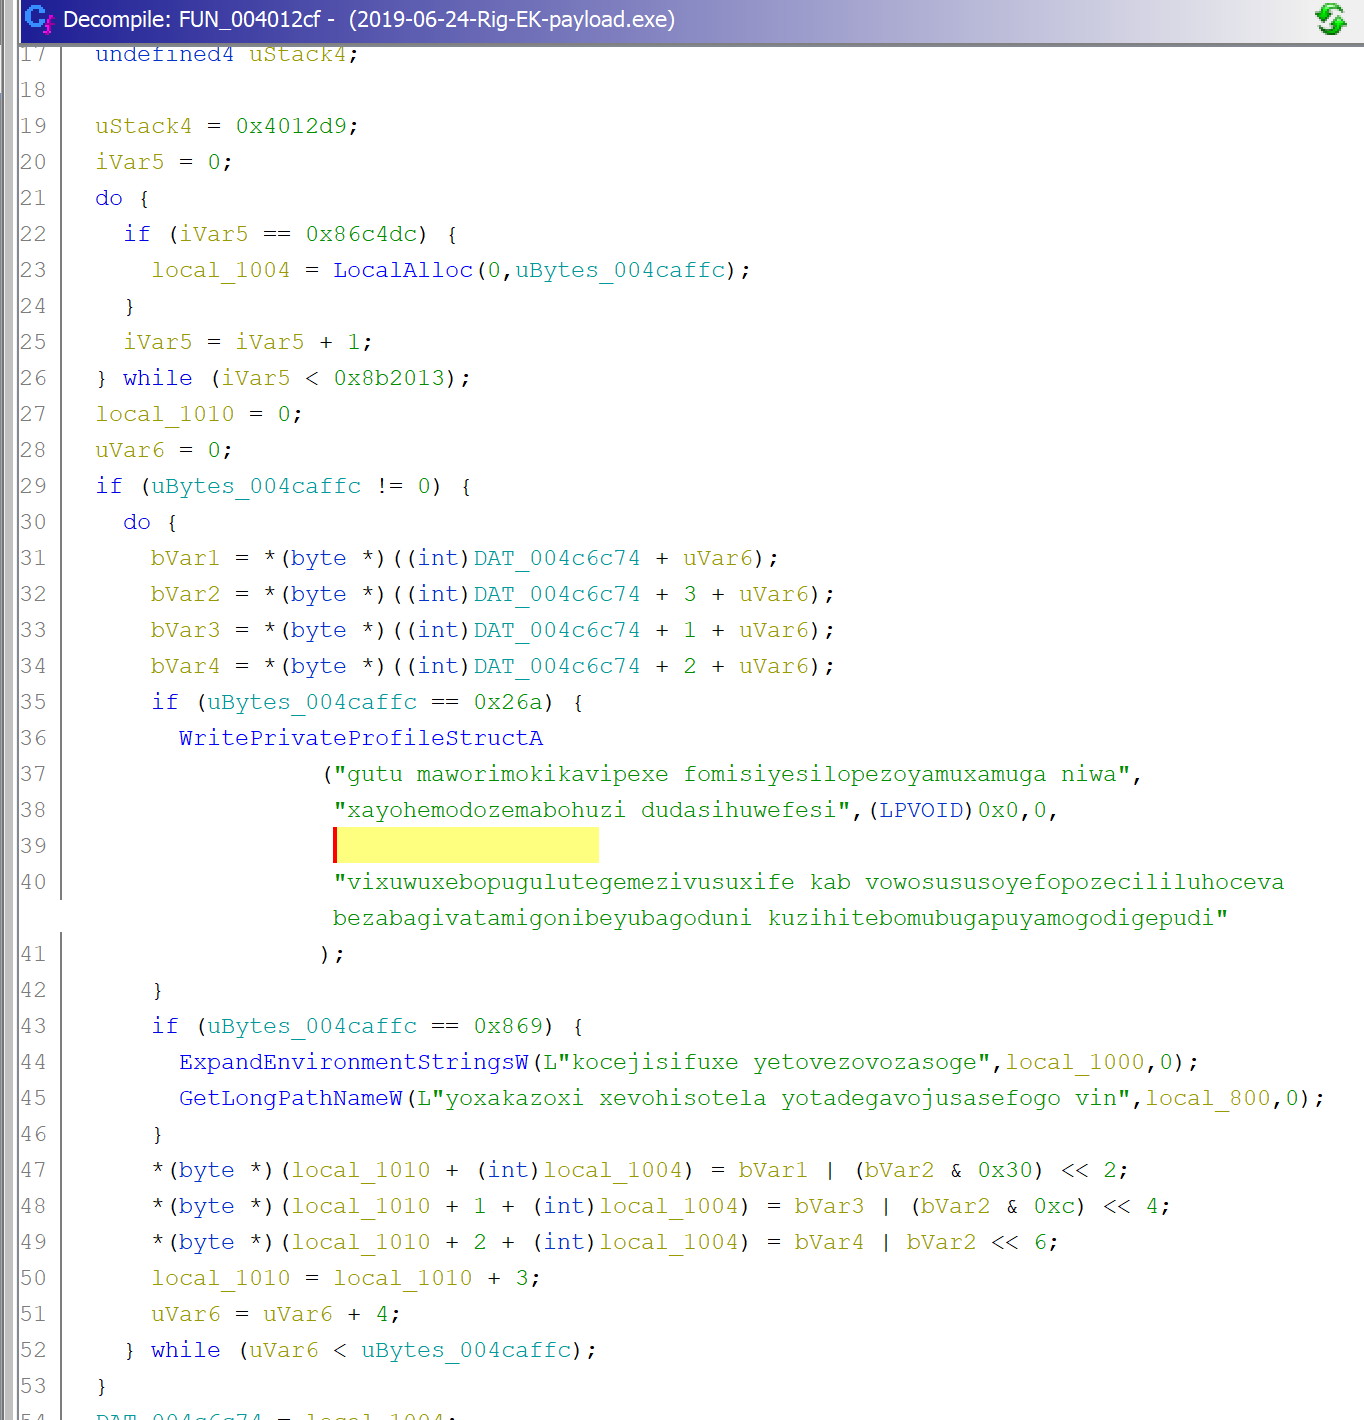
Let’s insert breakpoints on those functions.
- GetLongPathNameW
- WritePrivateProfileStructA
- ExpandEnvironmentStringsW
Let’s now focus on LocalAlloc and monitor the allocated space.
My case is 0x022B6020 and has the same size has previous LocalAlloc. Maybe some data exchange will happen here. Create a breakepoint on execute and a access breakpoint on the first allocated memory (0x0211A000)
Now we are going to move the first allocated memory into cl register (byte by byte) as shown:

We let it copy and then another crash!
So it seems our breakpoints on the allocated memory is somehow delay the instructions so we can disable it and execute until return! Interesting is that the functions WritePrivateProfileStructA, ExpandEnvironmentStringsW and GetLongPathNameW wasn’t called.
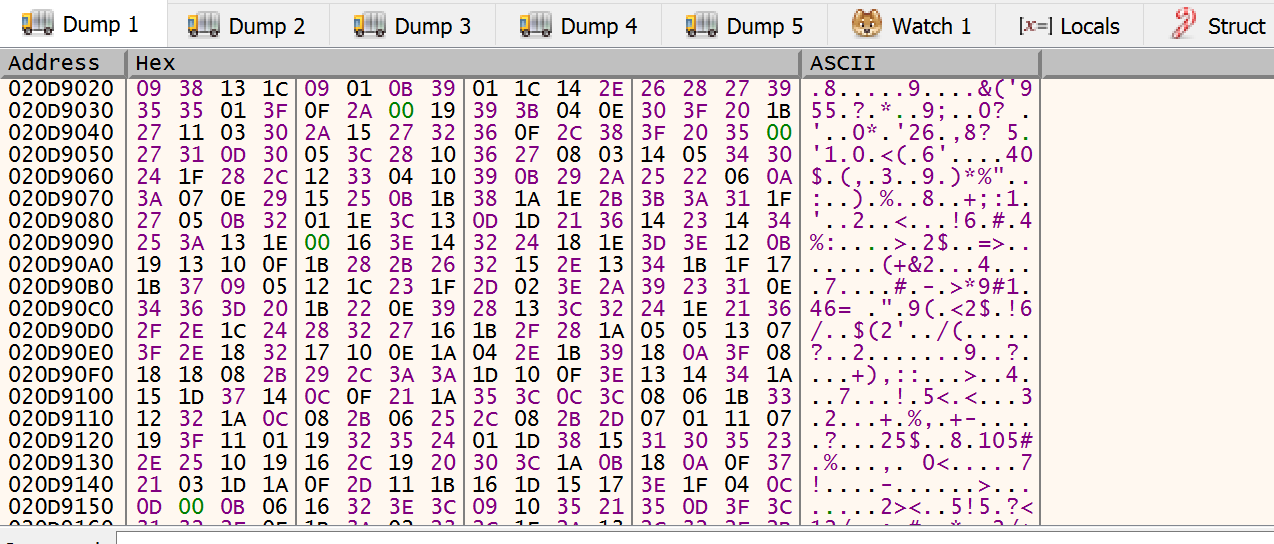
The first and second memory segments looks like this:
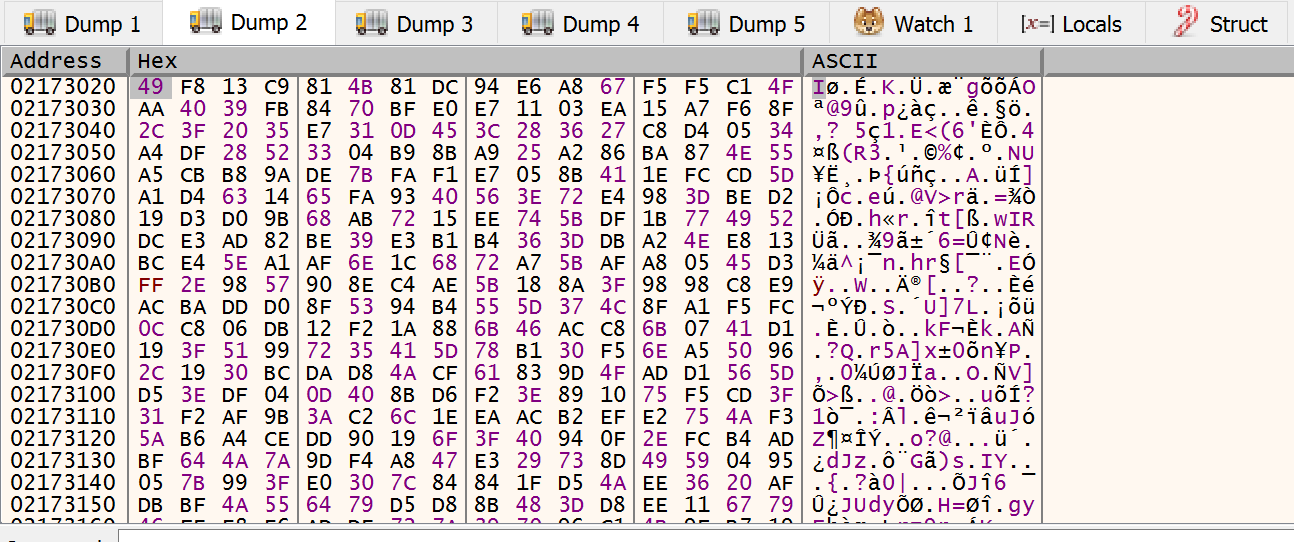
At this time we want to move further. So hit the run again and we can see kernel32.dll is being loaded dynamically. We don’t have to bother about this now because we inserted breakpoints on important Windows APIs (like VirtualProtect). After this being loaded VirtualProtect is called.
The function changes permissions on memory of calling process. On stack we can see the following data being pushed as arguments:

BOOL VirtualProtect(
  LPVOID lpAddress, //base address
  SIZE_T dwSize, //size of allocated memory to be changed
  DWORD  flNewProtect, //protection defined (read/write/execute/...)
  PDWORD lpflOldProtect //this points the the thread stack
);
The base address belongs to the second alloc. As we can see on memory dump, it has just, what lookslike for us, junk. But the newprotect dword is 0x40 which is defined as PAGE_EXECUTE_READWRITE. So, the malware is changing the permissions to be able to execute on this memory segment.
This said we can change the breakpoint on 0x020D9000 to be just READ and 0x02173000 to be execute.
Before VirtualAlloc execute the segments looks like this:

We execute until return and we can see the protections changed on 0x02173000

Right after virtualprotect we can see a lot of mov instructions:

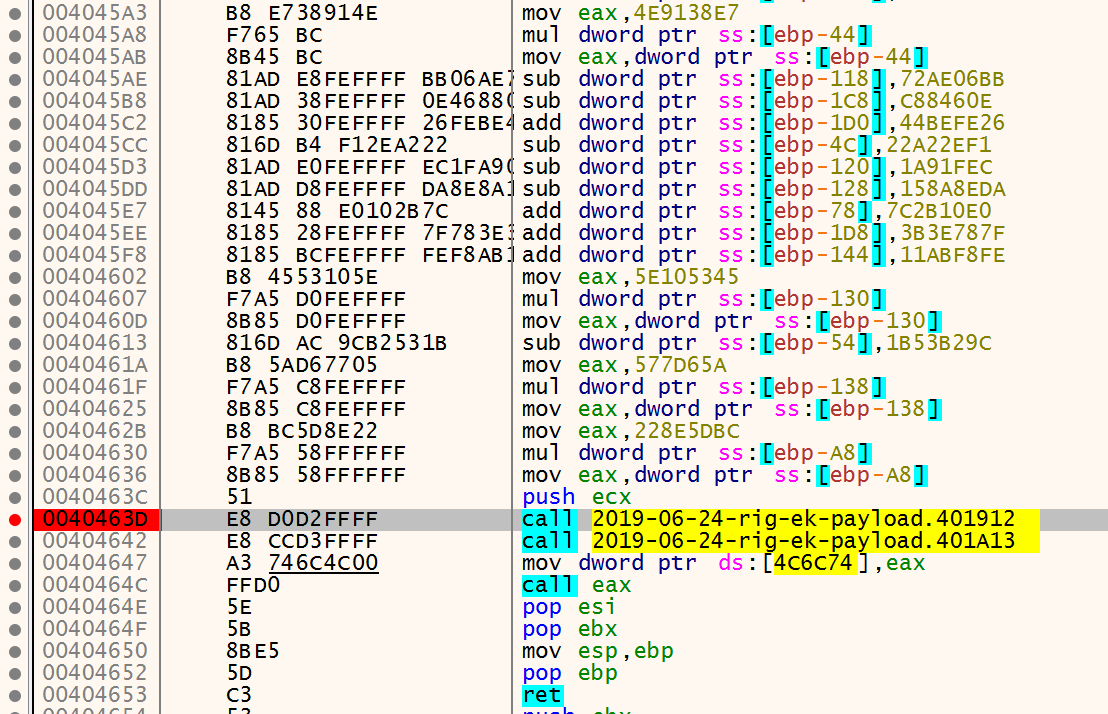
Viewing this on C-style it’s something like this:
  //... the other locals above.
  local_148 = 0x34eba593;
  local_58 = 0x738a618c;
  FUN_00401912();
  DAT_004c6c74 = (code *)FUN_00401a13();
  (*DAT_004c6c74)(); //jump to this location, probably the first stage?
  return;
We add a breakpoint right the call FUN_00401912().
void FUN_00401912(void)

{
  int iVar1;
  uint uVar2;
  uint uVar3;
  _OSVERSIONINFOEXA local_a0;

  iVar1 = DAT_004c6c74;
  uVar2 = uBytes_004caffc / 8;
  uVar3 = 0;
  if (uVar2 != 0) {
    do {
      if (uBytes_004caffc == 0x115d) {
        VerifyVersionInfoA((LPOSVERSIONINFOEXA)&local_a0,0,0.00000000);
      }
      FUN_0040166e((uint *)(uVar3 * 8 + iVar1));
      uVar3 = uVar3 + 1;
    } while (uVar3 < uVar2);
  }
  return;
}
If you move forward you see that probably you won’t hit the VerifyVersionInfoA. You keep hit run until a new, the third, allocation is invoked. This case VirtualAlloc. On this run the memory is 0x02200000. We monitor this segment and insert a access breakpoint. When you start stepinto you can see the MZ starting to be written:
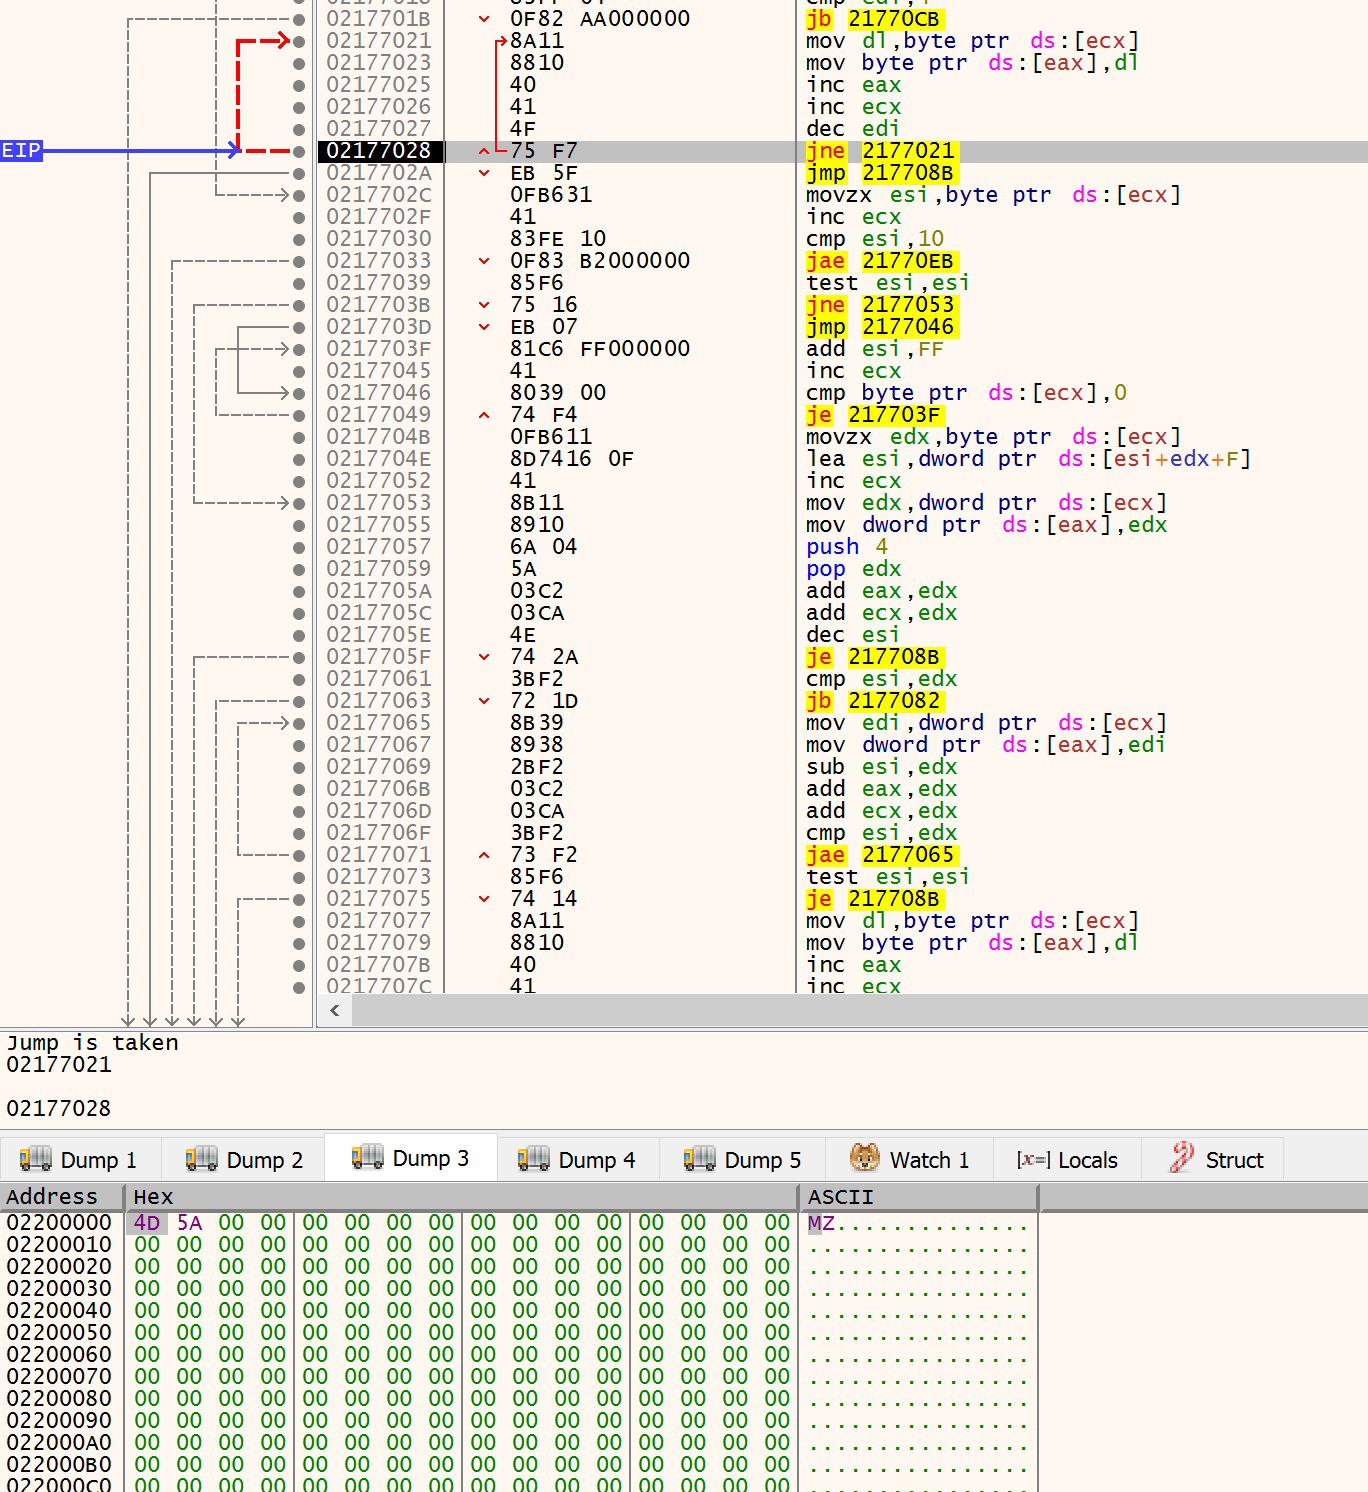
Note the registers (at interation 3):

mov dl,byte ptr ds:[ecx] ; ecx points to source
mov byte ptr ds:[eax],dl ; eax points to destination
inc eax ; (src)++
inc ecx ; (dst)++
dec edi ; VS compiler being stupid?
The memory dump on [ecx]:
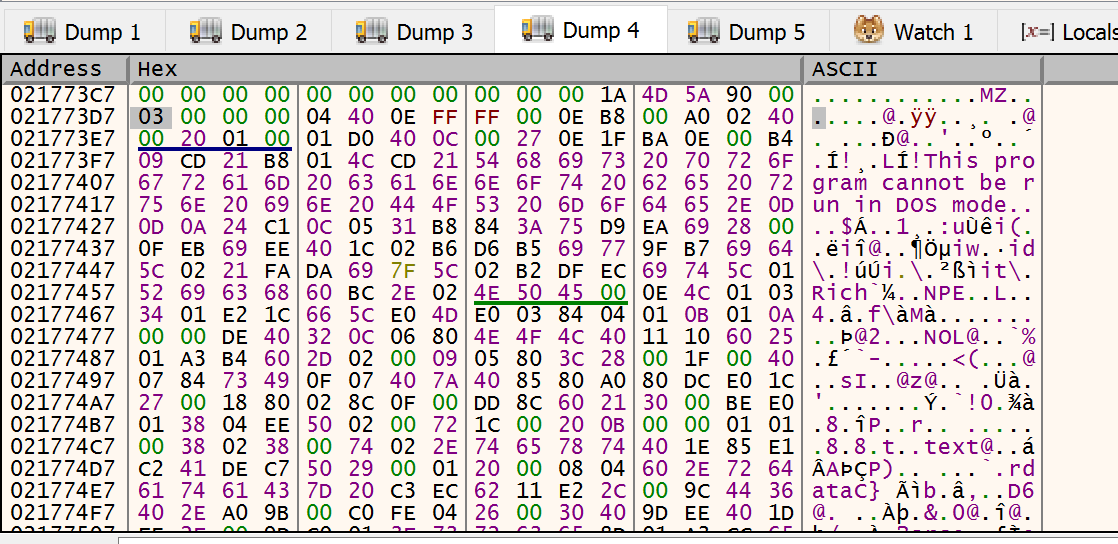
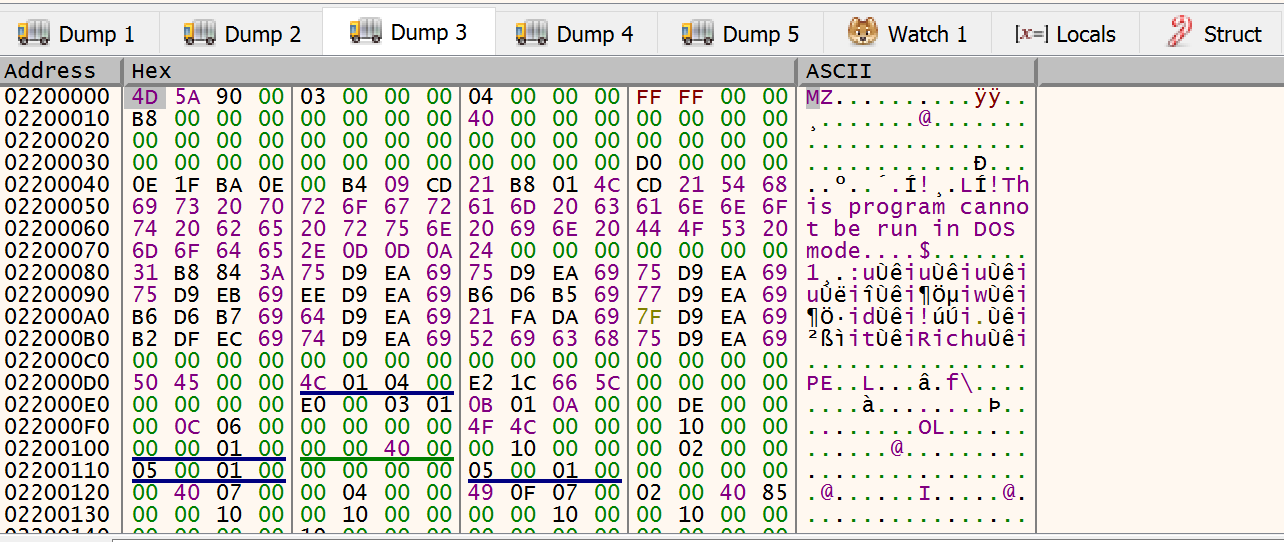
We can see it’s a PE file. The DOS header, the segment table, etc.
What is more interesting is that this instructions are being executed in 0x02173000. This is our shell code, in 2nd alloc being executed, copying a PE file in memory (from the same segment) to another third allocation.
We can now extract this. Since it begin in 0x21773D3 and ends in 0x21DAFF9 so it has 408 614 bytes.

It’s probable not be alligned so we can use HxD to adjust the MZ magic number to offset 0. It’s ok to have a larger PE than normal. What is most important is the first part.
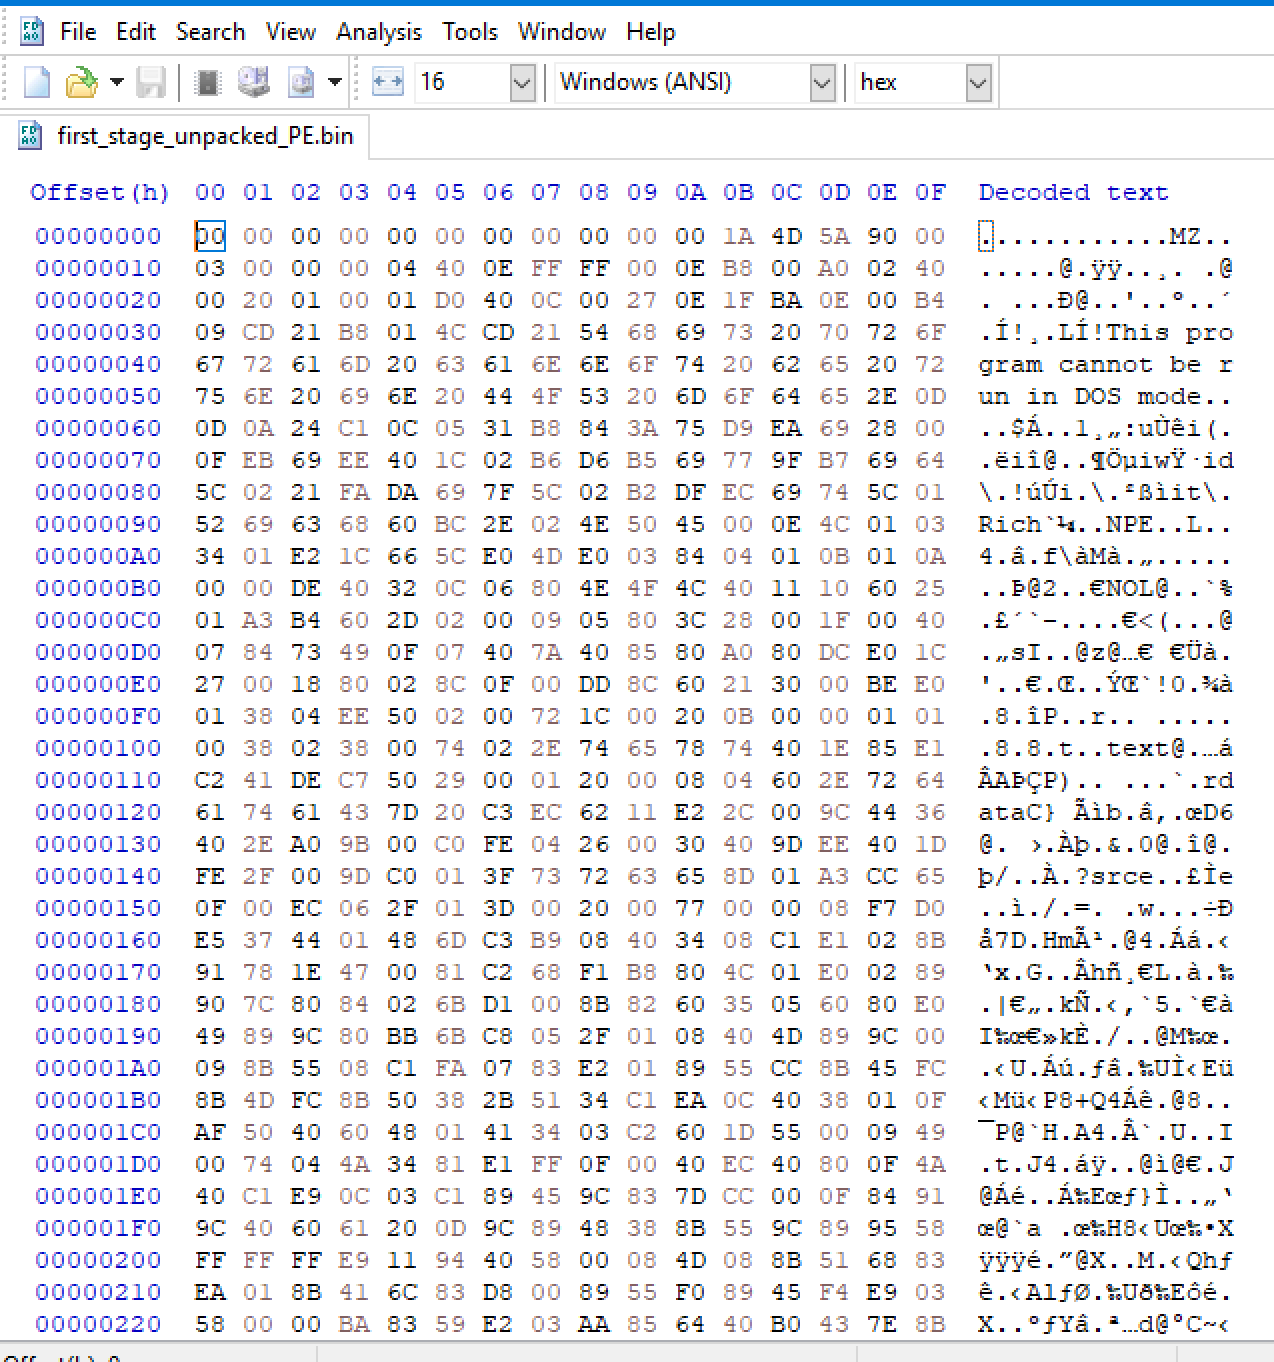
If we scroll down we can see the absence of a large null bytes sequence on the PE. This means the PE is unmamped, so is in disk format ready to be loaded.
When I try to open on PE Bear this message appears:
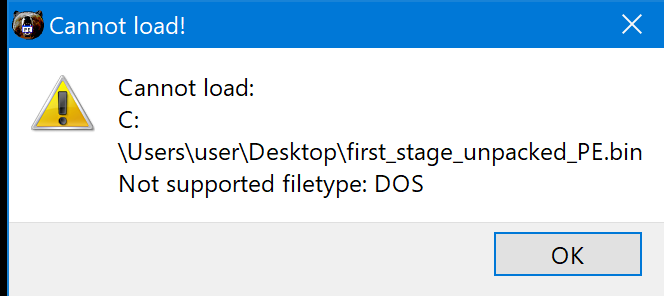
If you let the copy continue you notice that the null bytes are being copied OK. Maybe it’s full of junk and the copy task cleans it up (to avoid being reversed eng).
